Monitoring and Management with J2SE 5.0
By Weiqi Gao, OCI Principal Software Engineer
February 2005
Introduction
You've heard about generics. You've heard about autoboxing. You've even heard us talking about "Other New Features" of Java 2 Standard Edition (J2SE) 5.0 a few months ago. Yet there are still features of the latest JDK that are under covered. The new monitoring and management features fall into this category.
J2SE 5.0 contains the following components that together provide the monitoring and management capabilities:
- Java Management Extension (JMX) defines the architecture for managing Java applications,
- JMX Remote API defines how a remote management application connects to and talks with a managed JVM and its applications,
- A set of Platform MBeans instruments the JVM itself and allows performance and resource consumption data of the JVM to be monitored from a remote management application, and
- A set of remote monitoring and management tools.
In this article, I will present the basic architecture of JMX and JMX Remote API, explain the terminologies of JMX, discuss the JMX support classes in J2SE 5.0, and demonstrate the usage of JConsole and other tools for monitoring and management in J2SE 5.0. We then take a look at the Platform MBeans and explore some of their capabilities.
JMX Architecture
JMX (JSR 3) and JMX Remote API (JSR 160) define a standard architecture for application and network management and monitoring in the Java programming language. The overall architecture is divided into three levels:
- Instrumentation Level
- Agent Level
- Distributed Services Level (Manager Level)
The instrumentation level of the JMX specification deals with writing Java classes for application resources or even external devices to make them manageable through JMX. The classes that we write in the instrumentation level are called Managed Beans, or MBeans. There are four kinds of MBeans that one can write: Standard MBeans, Dynamic MBeans, Model MBeans, and Open MBeans.
The agent level of the JMX specification defines interfaces for the standard MBeanServer and a set of standard services that are available in all standard compliant JMX implementations. The MBeanServer is a registry of MBeans. The standard services are themselves implemented as MBeans. The four services are Advanced Dynamic Loading (MLets), Monitoring, Timer Service and Relation Service. The MBeanServer and the standard services are collectively called the agent.
The distributed services level or manager level is defined in a separate JMX Remote API specification and rounds out the JMX architecture. It defines standard ways for accessing the MBeanServer running inside one JVM, the managed application, from either another JVM or another manager application, using JMX connectors and protocol adapters.
JMX Lingo
It is not the goal of this article to do a full presentation on JMX. Instead I will define some of the terms used in JMX. An important foundation of the J2SE 5.0 monitoring and management features is JMX and knowing these basic vocabularies helps in understanding these features.
- Resource
The thing that is to be managed. It can be an application, an implementation of a service, or a device that offers a Java interface. In the context of Java applications, the resources we want to manage are typically represented by Java classes. - Instrumentation
To instrument a resource is to provide one or more interfaces that can be used by the agent level to interact with the resource. These interfaces are called Managed Bean interfaces. - Managed Beans (MBeans)
An instrumented resource is a Managed Bean (MBean) that supports its MBean interfaces. An MBean interface defines the attributes, operations and notifications of the MBean in an abstract way. There are four ways to instrument a resource: write a standard MBean, a dynamic MBean, an open MBean, or a model MBean. - Standard MBeans
Standard MBean is the simplest way of writing an MBean. To instrument a Java classHelloas a standard MBean, one simply defines aHelloMBeaninterface and modifyHelloto implementHelloMBean. The getters and setters ofHelloMBeandetermine the attributes of the MBean. The other methods ofHelloMBeandetermine the operations of the MBean. - Dynamic MBeans
To instrument a Java classHelloas a dynamic MBean, one makesHelloimplement theDynamicMBeaninterface. No naming convention is involved. TheDynamicMBeaninterface has agetMBeanInfomethod that returns aMBeanInfoobject that describes the attributes, operations and notifications of the MBean. TheDynamicMBeaninterface also provides methods likegetAttribute,setAttribute,getAttributes,setAttributesandinvoke. These methods allows the attributes and operations of the MBean to be accessed in a dynamic fashion. - Open MBeans
An open MBean is a dynamic MBean that satisfies some additional requirements with respect to the data types. For a dynamic MBean to qualify as an open MBean, its attributes and operation parameters must all fall into predefined basic data types. The basic data types are composed of the wrapper types of the primitive types:String,Date,BigInteger,BigDecimal,ObjectName,CompositeDataandTabularData.CompositeDataandTabularDataallow the formation of arbitrarily complex data types. The key benefit of open MBeans is that no application specific classes are needed to access the MBean. This become important when the MBean is accessed from a remote JVM. - Model MBeans
A model MBean is an already written dynamic MBean that comes with any implementation of JMX. They provide more functionalities than a hand written dynamic MBean. Its MBean interface,ModelMBeanextendsDynamicMBeanand other interfaces with thesetModelMBeanInfoandsetManagedResourcemethods. So a set of model MBean instances can each be made to instrument a different Java class with a different MBean interface. - MBeanServer
TheMBeanServerinterface is at the center of the JMX architecture. It is a registry of MBeans. Everything that is done with JMX is done through anMBeanServer. There can be any number ofMBeanServersrunning simultaneously in a JVM, each managing its own share of MBeans. In J2SE 5.0, one particularMBeanServer, called thePlatformMBeanServer, is special. Unlike otherMBeanServerswhich are created fromMBeanServerFactory,PlatformMBeanServeris created fromManagementFactory. There will be only one instance of it in any JVM. Also, it has a set of platform MBeans already registered. - ObjectName
TheObjectNameclass represents a name of an MBean inside anyMBeanServer. Logically anObjectNameconsists of a domain name and a set of property-value pairs:[domainName]:property-value[,property=value]*.ObjectNamesare used in MBean registration with aMBeanServer. They are also used for querying theMBeanServerfor MBeans. - MBean Registration with MBeanServer
To register an MBean with aMBeanServer, one instantiates the MBean, constructs anObjectName, and calls theregisterMBeanmethod on theMBeanServer. Once registered, the attributes and operations are accessible from theMBeanServerwithout directly accessing the MBean instance. This level of decoupling is a key design goal of JMX. - Queries for MBeans in MBeanServer
To query anMBeanServerfor MBeans, one calls one of its query methods passing in anObjectNameand aQueryExp. When querying, the ObjectName may contain wild card characters*and?in the domain name part, and the wild card character*in the property-value pairs part. In the property-value pair part, the*represents a whole pair because a property-value pair is the smallest unit for MBean queries. - Accessing MBean Attributes Through MBeanServer
TheMBeanServerinterface containsgetAttribute,setAttribute,getAttributes, andsetAttributesmethods that are similar to the methods of the same names in theDynamicMBeaninterface, but with an additionalObjectNamefirst parameter. - Invoking MBean Methods Through MBeanServer
TheMBeanServer'sinvokemethod is similar to theinvokemethod ofDynamicMBean, but with an additionalObjectNamefirst parameter. - Listening for MBean Notifications Through MBeanServer
One can register notification listeners for a particular MBean through theMBeanServerinterface by first specifying anObjectNameand then the interested Notifications. - MBeanServerConnection
TheMBeanServerConnectioninterface is a superinterface ofMBeanServer. When a management application connects to anMBeanServerin another JVM, aMBeanServerConnectionis what it gets back. This interface has most of the methods ofMBeanServer. The few methods that are not present, such asregisterMBean, do not make sense from a remote management application. - JMX Connectors
The JMX Remote API defines the concept of JMX connectors and a specific JMX RMI connector. The JMX RMI connector consists of a connector server, which is an RMI server that can be attached to anMBeanServerand started to listen for connections, and a connector client, which is an RMI client that the management application uses to get anMBeanServerConnection.
JMX and Platform MBean Support in J2SE 5.0
J2SE 5.0 not only fully supports JMX and the JMX Remote API, but also support the PlatformMBeanServer and a set of platform MBeans that instrument the performance and resource consumption of the HotSpot JVM itself.
The platform MBeans are also called MXBeans. They are open MBeans. What these MXBeans instrument is defined by JSR 174, "Requirements for the Monitoring and Management for the JVM." These MXBeans give the Java developer an unprecedented peek into the inner workings of the J2SE 5.0 JVM. Some of the information gleaned through the MXBeans may be useful in debugging and troubleshooting a Java application. Some may be useful for the day-to-day management of a Java application during normal operations.
Here's the list of Java packages that corresponds to the various JSRs:
javax.management[.*]is where JMX classes livejavax.management.remote[.*]contain the JMX Remote APIjava.lang.managementcontains the platformMBeanServerand the platform MBeans (MXBeans)
Here's the list of platform MBeans that are supported by J2SE 5.0. They all belong to the java.lang.management package, except LoggingMXBean which is in the java.util.logging package:
ClassLoadingMXBeanCompilationMXBeanGarbageCollectorMXBeanMemoryMXBeanMemoryManagerMXBeanMemoryPoolMXBeanOperatingSystemMXBeanRuntimeMXBeanThreadMXBeanLoggingMXBean
The java.lang.management.ManagementFactory contains factory method for getting these MXBeans. Once an instance is obtained, one can interact with it directly without going through the JMX mechanisms. This will be the preferred way to interact with them from within the same JVM.
The java.lang.management.ManagementFactory also contains factory method for getting the PlatformMBeanServer. All of the MXBeans mentioned above are already registered with the PlatformMBeanServer. Java system properties exist that can be used to manipulate the PlatformMBeanServer, making it the easiest MBeanServer to use. For example, you can use java command line options to start the PlatformMBeanServer with the JMX RMI connector server already attached and started.
Aside from the MXBeans, one can also register application specific MBeans with the PlatformMBeanServer, making an application easily manageable.
The following is a very simple example that illustrates some capabilities of the PlatformMBeanServer with a standard MBean:
- // HelloMBean.java
- public interface HelloMBean {
- String getGreeting();
- void setGreeting(String greeting);
- }
- // Hello.java
- import java.lang.management.*;
- import javax.management.*;
-
- public class Hello implements HelloMBean {
- private String greeting;
-
- public Hello() {
- this.greeting = "Hello";
- }
-
- public Hello(String greeting) {
- this.greeting = greeting;
- }
-
- public String getGreeting() {
- return greeting;
- }
-
- public void setGreeting(String greeting) {
- this.greeting = greeting;
- }
-
- public static void main(String[] args) throws Exception {
- Hello hello = new Hello();
- ObjectName name = new ObjectName("hello:type=Hello");
- MBeanServer mbeanServer = ManagementFactory.getPlatformMBeanServer();
- mbeanServer.registerMBean(hello, name);
- System.out.println(mbeanServer.getAttribute(name, "Greeting"));
- for (Object o : mbeanServer.queryNames(new ObjectName("java*:*"), null)) {
- System.out.println(o);
- }
- // Keep around so that we can examine this app from JConsole
- Thread.sleep(Long.MAX_VALUE);
- }
- }
[weiqi@gao] $ java Hello
Hello
java.lang:type=Compilation
java.lang:type=MemoryManager,name=CodeCacheManager
java.lang:type=GarbageCollector,name=Copy
java.lang:type=MemoryPool,name=Perm Gen [shared-ro]
java.lang:type=MemoryPool,name=Eden Space
java.lang:type=Runtime
java.lang:type=ClassLoading
java.lang:type=MemoryPool,name=Survivor Space
java.lang:type=Threading
java.lang:type=GarbageCollector,name=MarkSweepCompact
java.util.logging:type=Logging
java.lang:type=OperatingSystem
java.lang:type=Memory
java.lang:type=MemoryPool,name=Code Cache
java.lang:type=MemoryPool,name=Perm Gen [shared-rw]
java.lang:type=MemoryPool,name=Tenured Gen
java.lang:type=MemoryPool,name=Perm Gen
In this example, we exercised MBean registration, MBean attribute accessing, and MBean name querying. Notice that since we performed the query with a wild card ObjectName of java*:*, we get back an array of ObjectNames whose domain name all start with java. Although the JMX specification does not mandate it, it is customary to use a Java package name as the domain name of MBeans.
We will have occasion to use this program again in the next section where we talk about the monitoring and management tools that come with J2SE 5.0.
J2SE 5.0 Monitoring and Management Tools
J2SE 5.0 includes several newly added command line tools and a GUI tool for monitoring and management of JVMs:
jpsjstatJVM statistics monitoring tooljstatdJVM jstat daemonjconsole
The Java Monitoring and Management Console
All four tools are labeled "experimental" in the J2SE 5.0 documentation. Please keep this in mind as you explore their usage.
The first three, jps, jstat, and jstatd grow out of the jvmstat project that was freely available from Sun. They take advantage of JVM instrumentations that began to be added since version 1.4.1. They are similar to the Unix ps tool, which also offers remote operation possibilities.
The jps command is the easiest to use. Without any command line options, it prints out local JVM ids (lvmids) and the simple name of the Java class that started them:
[weiqi@gao] $ jps
27636 Jps
27628 Hello
The -l option causes jps the fully qualified names to be printed:
[weiqi@gao] $ jps -l
27645 sun.tools.jps.Jps
27628 Hello
The -m option prints the arguments passed to the main method. The -v option prints the arguments passed to the JVM. The -V option prints the arguments passed to the JVM flag files (~/.hotspotrc).
[weiqi@gao] $ jps -l -m -v -V
27705 sun.tools.jps.Jps -l -m -v -V -Dapplication.home=/usr/lib/jvm/java-1.5.0-s
un-1.5.0.01 -Xms8m
27628 Hello
The jps command can be used to inspect JVM processes running on a remote machine provided an instance of jstatd is running on the remote machine. To do this you need to specify a host Id:
[weiqi@gao-2004] $ jstatd -J-Djava.security.policy=jstatd.all.policy

[weiqi@gao-2003] $ jps -l -m -v -V gao-2004
28822 sun.tools.jstatd.Jstatd -Dapplication.home=/usr/lib/jvm/java-1.5.0-sun-1.5
.0.01 -Xms8m -Djava.security.policy=jstatd.all.policy
28854 Hello
Here we first started jstatd on host gao-2004, and then inspected the java processes running on gao-2004 from the host gao-2003. The host name passed on the jps command line is an abbreviated version of the URL rmi://gao-2004:1099/JStatRemoteHost.
The above example also showed how to start the jstatd daemon. By default it starts an RMI registry that listens on port 1099 and binds itself to the registry as JStatRemoteHost. A different port number can be specified with the -p option, and a different name can be specified with the -n option. It also requires a policy file jstatd.all.policy in the current directory:
grant codebase "file:${java.home}/../lib/tools.jar" {
  permission java.security.AllPermission;
};
The jstat command can be used to display performance statistics of JVMs. The monitored JVMs can be local (identified by the local JVM Id) or remote (identified by lvmid@hostname or rmi://lvmid@hostname:port/JStatObjectName if no defaults are used.)
[weiqi@gao-2003 weiqi] $ jstat -gcutil 28822@gao-2004 1000 5
  S0     S1     E      O      P     YGC     YGCT    FGC    FGCT     GCT
  0.00   0.00  65.88   5.90   8.43    114    0.091    49    1.960    2.051
  0.00   0.00  82.22   5.90   8.43    114    0.091    49    1.960    2.051
  0.00 100.00   0.00   6.19   8.43    115    0.092    49    1.960    2.052
  0.00 100.00  16.93   6.19   8.43    115    0.092    49    1.960    2.052
  0.00 100.00  33.64   6.19   8.45    115    0.092    49    1.960    2.052
Here we monitored the JVM statistics of Java process with a lvmid of 28822 running on gao-2004 from gao-2003. We monitored the garbage collection statistics 5 times at 1000 millisecond intervals.
Jstat supports twelve output options like -gcutil. One and only one output option must be selected when invoking jstat. Otherwise jstat prints a usage message and exits. Please refer to the online documentation for further details.
Using JConsole
JConsole differs from the other three tools in two ways: It is a GUI tool and it talks directly with the monitored JVM using JMX. In order for a JVM to be monitored by JConsole, it must be started with the appropriate properties.
To enable JConsole monitoring from the localhost only, start the JVM with the -Dcom.sun.management.jmxremote command line argument:
[weiqi@gao] $ java -Dcom.sun.management.jmxremote HelloTo enable JConsole monitoring from a remote machine, more properties need to be specified. The easiest and least secure way is the following:
[weiqi@gao] $ java -Dcom.sun.management.jmxremote.port=9999 -Dcom.sun.management
.jmxremote.authenticate=false -Dcom.sun.management.jmxremote.ssl=false Hello
This allows JConsole connections from any other host through clear sockets without password authentication. You can enable password authentication or secure sockets or both by setting the respective properties to true (or not specifying at all).
To enable password authentication, you need to copy $JAVA_HOME/jre/lib/management/jmxremote.password.template to your home directory, rename it to jmxremote.password, uncomment the last two lines and use them as the username and password when you connect from JConsole. It is also important to change the permission on the file so that only its owner can read or write the file.
[weiqi@gao-2004] $ java -Dcom.sun.management.jmxremote.port=9999 -Dcom.sun.manag
ement.jmxremote.password.file=/home/weiqi/jmxremote.password -Dcom.sun.managemen
t.jmxremote.ssl=false Hello
Connecting to either a local JVM or are remote JVM from JConsole is done through the login screens:
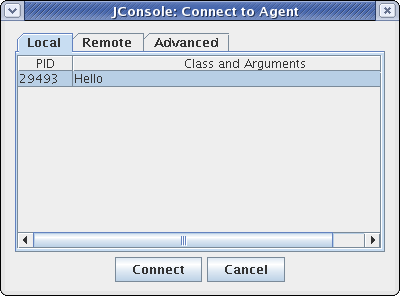
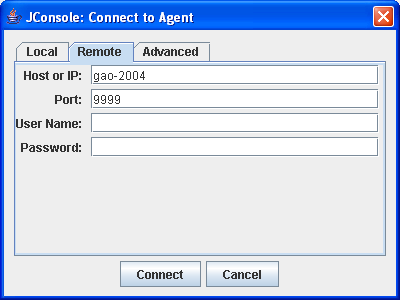
Once connected, the JConsole main screen appears. It contains the following tabs: Summary, Memory, Threads, Classes, MBeans, and VM. Each tab contains summary tests or continuously updated charts representing the various statistics of the monitored JVM. The MBeans tab is reproduced below:
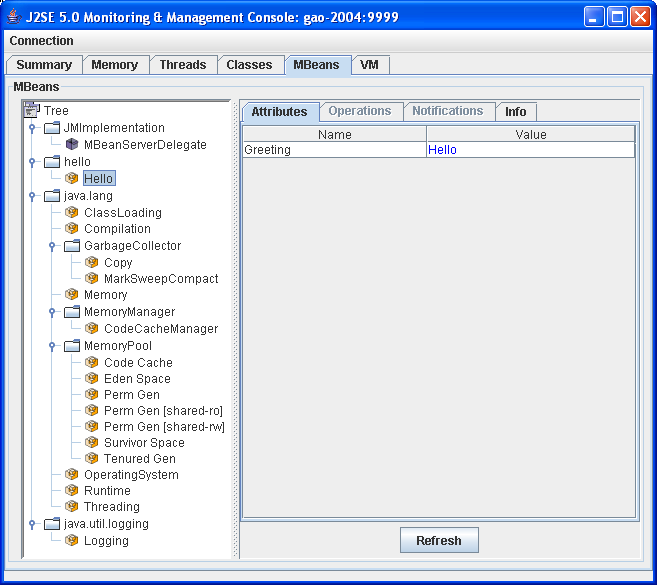
Did you see our Hello MBean and its attribute Greeting=Hello?
The platform MBean's also show up in the MBeans tab. It is worthwhile to explore their attributes, operations, and notifications to discover the rich information that they convey.
Programmatic Connection To Platform MBeanServer
When you start the JVM with the com.sun.management.jmxremote.port property set, the PlatformMBeanServer is automatically started with all the platform MBeans registered and the JMX RMI connector server started.
JConsole is not the only program that can connect to this connector server. Any J2SE 5.0 program can connect to this PlatformMBeanServer by using the JMX RMI connector client. The following simple program demonstrate how this is done.
- // MyJMXClient.java
- import java.util.*;
- import javax.management.*;
- import javax.management.remote.*;
- import javax.management.remote.rmi.*;
-
- public class MyJMXClient {
- public static void main(String[] args) throws Exception {
- HashMap env = new HashMap();
- String[] credentials = new String[] {"controlRole", "R&D"};
- env.put("jmx.remote.credentials", credentials);
- JMXServiceURL url =
- new JMXServiceURL("service:jmx:rmi:///jndi/rmi://gao-2004:9999/jmxrmi");
- JMXConnector c = JMXConnectorFactory.connect(url, env);
- MBeanServerConnection s = c.getMBeanServerConnection();
- for (Object o : s.queryNames(new ObjectName("hello:*"), null)) {
- System.out.println(s.getAttribute((ObjectName) o, "Greeting"));
- }
- }
- }
[weiqi@gao-2003] $ java MyJMXClient
Hello
Exploring the Platform MBeans
Now that we had a good understanding of the JMX architecture and how J2SE 5.0 supports it, it's time to take a look at each of the platform MBeans:
- ClassLoadingMXBean
- CompilationMXBean
- GarbageCollectorMXBean
- MemoryMXBean
- MemoryManagerMXBean
- MemoryPoolMXBean
- OperatingSystemMXBean
- RuntimeMXBean
- ThreadMXBean
- LoggingMXBean
These platform MBeans can be accessed from the local JVM using factory methods of ManagementFactory:
MemoryMXBean mbean = ManagementFactory.getMemoryMXBean();They can also be accessed from remote management applications using the MXBean proxy method of ManagementFactory:
MBeanServerConnection mbs = // get the connection
RuntimeMXBean mbean = ManagementFactory.newPlatformMXBeanProxy(
  mbs, ManagementFactory.RUNTIME_MXBEAN_NAME, RuntimeMXBean.class);
Once you get the reference or proxy of a platform MBean, you can access its attributes, invoke its operations and listen to its notifications directly. In the rest of this section, I will simply list some of the most interesting attributes, operations and notifications of each platform MBean and let you use your imagination to figure out cool ways they can be weaved together to generate useful services for your applications.
ClassLoadingMXBean
Attributes: LoadedClassCount, TotalLoadedClassCount, UnloadedClassCount, Verbose (settable).CompilationMXBean.
Attributes: Name, TotalCompilationTime, CompilationTimeMonitoringSupportedGarbageCollectorMXBean
Attributes: CollectionCount, CollectionTime.MemoryMXBean
Attributes: HeapMemoryUsage, NonHeapMemoryUsage, ObjectPendingFinalizationCount, Verbose (settable). Operations: gc. Notifications: usage threshold, collection usage threshold.MemoryManagerMXBean
Attributes: MemoryPoolNames, Name, ValidMemoryPoolMXBean
Attributes: All sorts of interesting memory statistics.OperatingSystemMXBean
Attributes: Arch, AvailableProcessors, Name, Version.RuntimeMXBean
Attributes: All sorts of interesting runtime properties including BootClassPath, ClassPath, LibraryPath, StartTime, Uptime.ThreadMXBean
Attributes: AllThreadIds, CurrentThreadCpuTime, CurrentThreadUserTime, DaemonThreadCount, PeakThreadCount, ThreadCount, TotalStartedThreadCount, etc. Operations: getThreadInfo, findMonitorDeadLockedThreads, getThreadUserTime, getThreadCpuTime.LoggingMXBean
Attributes: LoggerNames. Operations: getParentLoggerName, getLoggerLevel, setLoggerLevel.
Summary
The introduction of JMX, the JMX Remote API and the inclusion of the platform MBeanServer and the platform MBeans into J2SE 5.0 make it easier to build applications that are more manageable than ever before.
JVMs as well as applications running inside the JVMs can be monitored and managed either locally or remotely. Critical resources of applications can be instrumented and managed along side the JVM resources.
JConsole, custom management applications, third party JMX consoles and system management software packages that support JMX can be leveraged to manage multiple mission critical applications from a central location, thus making the operations of the applications more efficient and more responsive.
References
- [1] JMX
http://java.sun.com/j2se/1.5.0/docs/guide/jmx/index.html - [2] Monitoring and Management
http://java.sun.com/j2se/1.5.0/docs/guide/management/index.html - [3] Using JConsole to Monitor Applications
http://java.sun.com/developer/technicalArticles/J2SE/jconsole.html - [4] Getting Started with Java Management Extensions (JMX): Developing Management and Monitoring Solutions
http://java.sun.com/developer/technicalArticles/J2SE/jmx.html - [5] Java Specialists' Newsletter
http://www.javaspecialists.co.za/archive/Issue091.html
http://www.javaspecialists.co.za/archive/Issue092.html - [6] MX4J, a popular Open Source JMX implementation
http://mx4j.sourceforge.net/ - [7] MC4J, a popular Open Source management console
http://mc4j.sourceforge.net/
